
nmapUnleashed Docs
📊 Dashboard Overview (Main View)
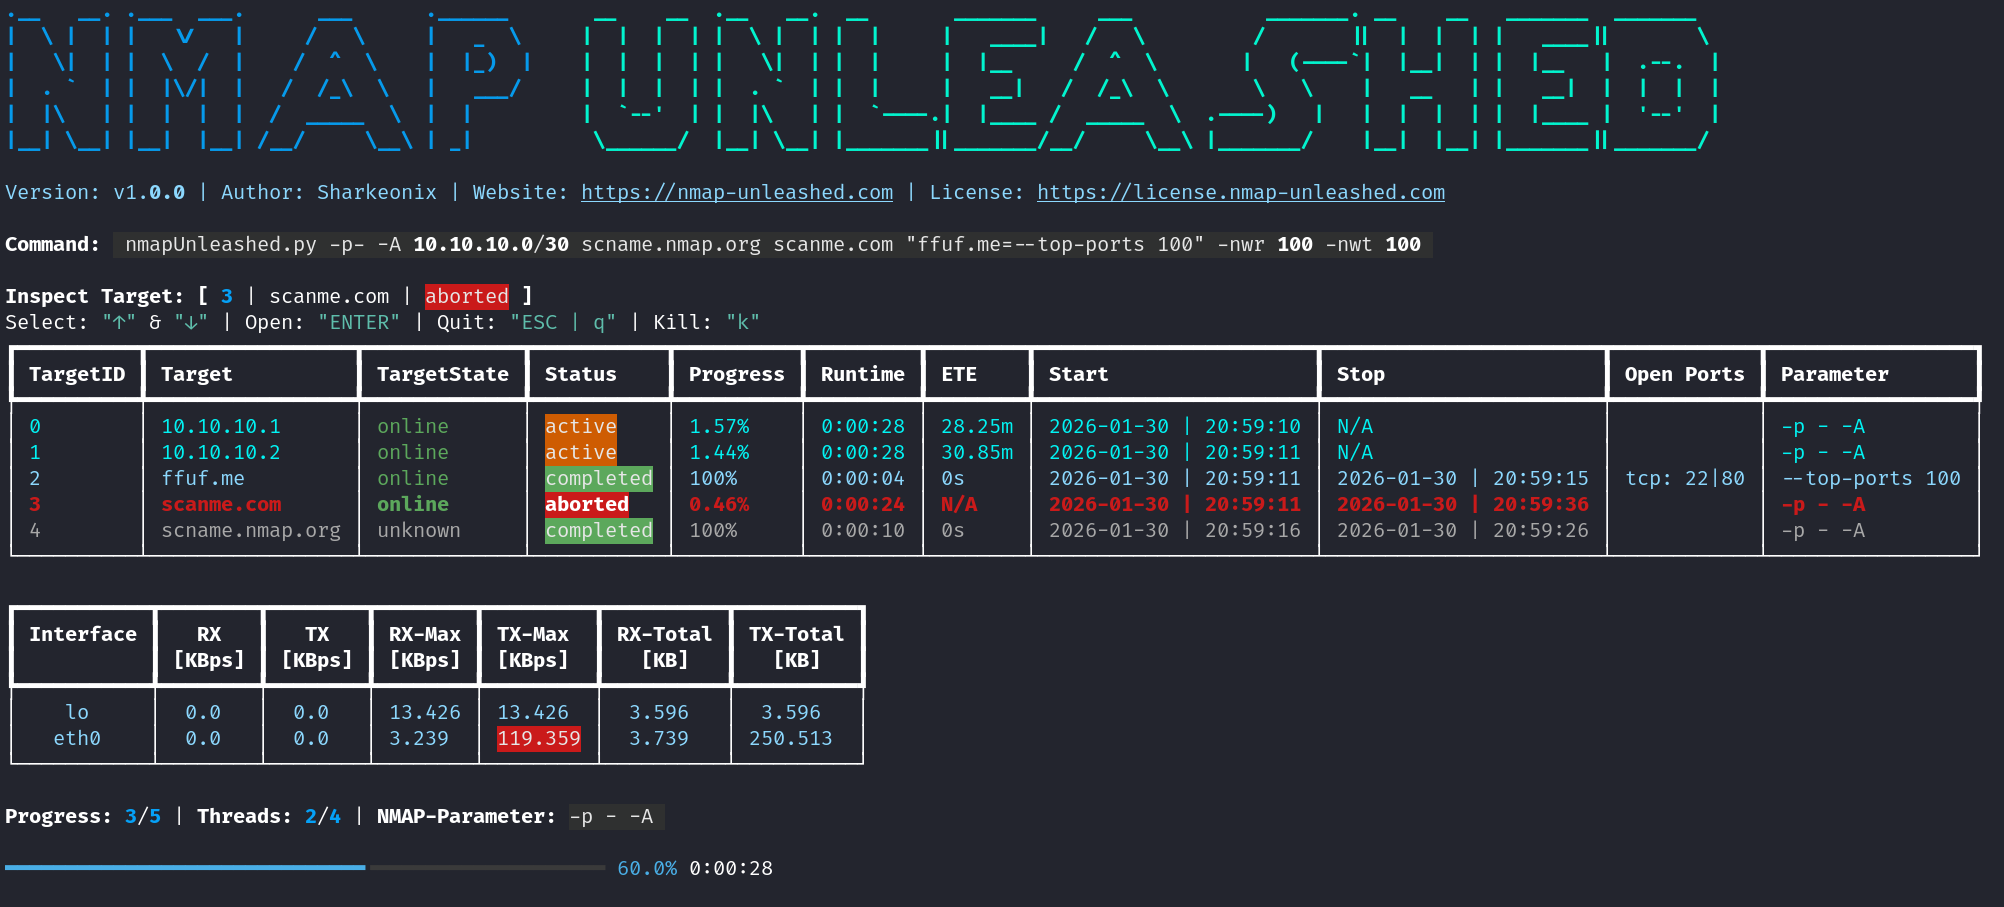
Banner
Displays the banner along with the current version, initial author/maintainer, project website, and a link to the license.
Command
Shows the options and arguments used for the current execution. Useful for documentation and quickly re-running the same scan.
Inpsector
Displays the currently selected target, its ID, and scan status.
Also shows the Navigator, where:
- ↑ / ↓ to select targets
- ENTER to open detailed view
- q / ESC to quit detailed view
- k to manually abort a scan (with confirmation) if it takes too long
Scan Overview
Displays all scans and their statuses with additional information: | Name | Description | | ----------- | ---------------------------------------------- | | TargetID | nmapUnleashed rolling identifier of the target | | Target | Target’s IP address or domain name | | TargetState | Whether the target is online or offline | | Status | Scan status (active, completed, etc.) | | Progress | Nmap’s self-reported progress of the scan | | Runtime | Current runtime of the scan | | ETE | Nmap’s estimated time remaining for the scan | | Start | Start date and time of the scan | | Stop | Stop date and time of the scan | | Open Ports | Currently discovered open ports | | (Parameter) | Target-specific parameters (if used) |
Network Overview
Displays network usage statistics with optional warnings: | Name | Description | | --------- | -------------------------------------- | | Interface | Network interface being monitored | | RX | Current incoming network data | | TX | Current outgoing network data | | RX-Max | Maximum received data rate | | TX-Max | Maximum transmitted data rate | | RX-Total | Total amount of data received | | TX-Total | Total amount of data transmitted |
Progressbar
Shows the number of finished and total scans, current and total threads, the general Nmap parameters in use, progress percentage, and total runtime.
📊 Dashboard Overview (Detailed View)
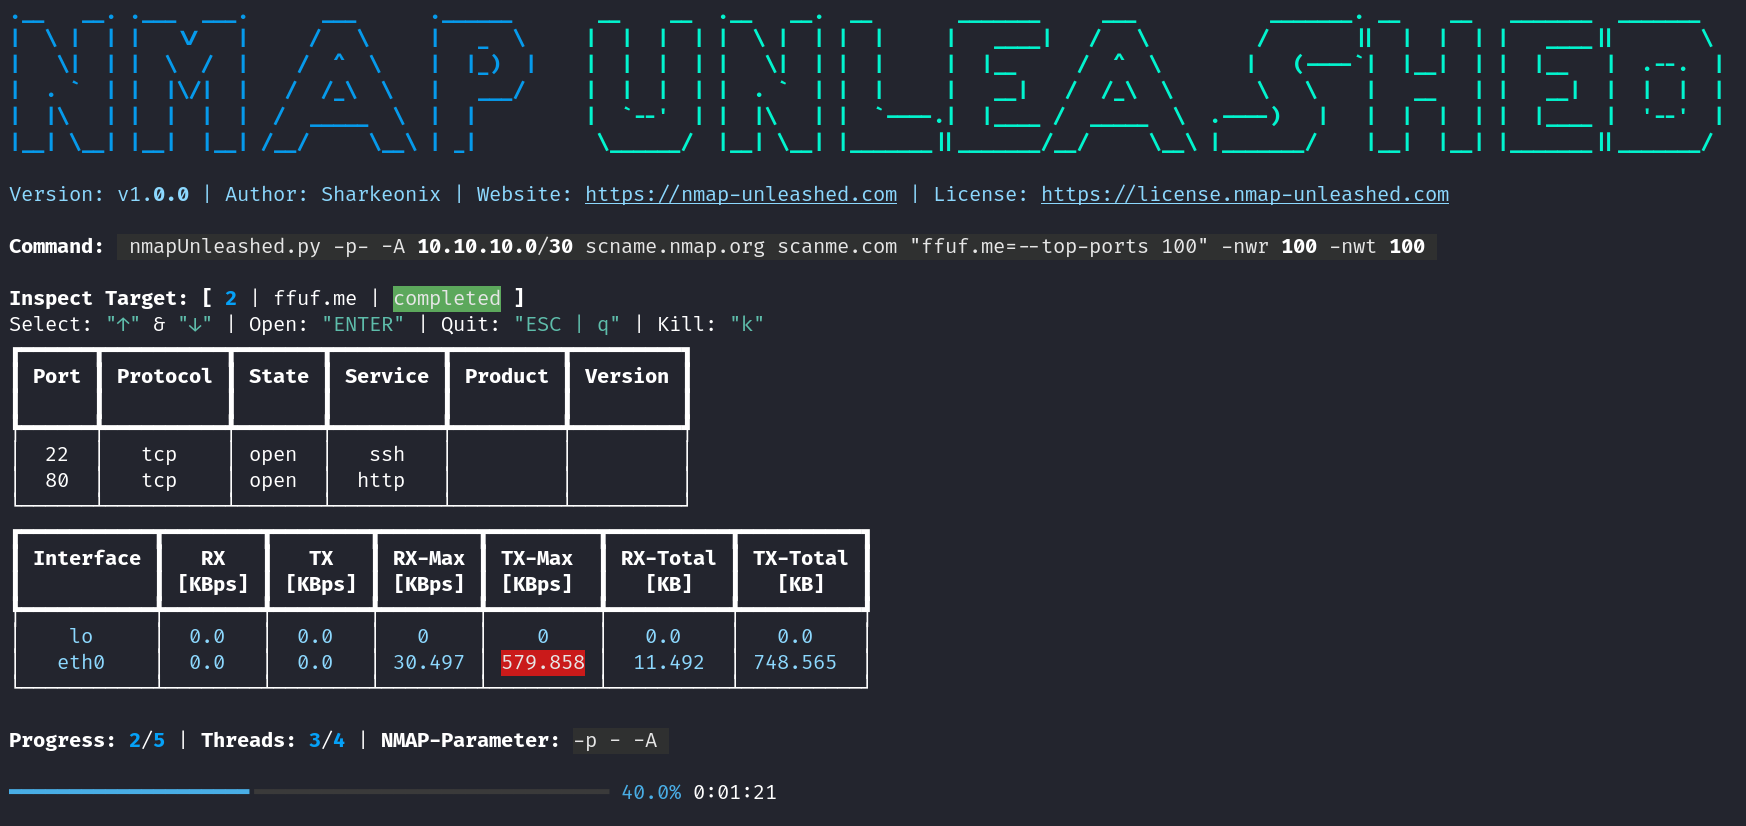
Detailed Scan View
When a target is selected and opened, the detailed view displays all available information for that scan. You can switch between targets within this view.
Navigation keys:
- ↑ / ↓ to select targets
- q / ESC to quit detailed view
- k to manually abort a scan (with confirmation) if it takes too long
Note:
Columns in parentheses ( ) are only displayed after the scan completes, as Nmap only provides this detailed information at the end. Until then, only Port, Protocol, and State are shown.
| Name | Description |
|---|---|
| Port | Network port number |
| Protocol | Protocol used (TCP or UDP) |
| State | Port state (open, closed, etc.) |
| (Service) | Identified service |
| (Product) | Product associated with the service |
| (Version) | Version of the identified service/product |